Executive summary
1. The EU is structurally short of critical refined products.
Although a small net exporter of refined products overall, the EU is a net importer of diesel, jet fuel and LPG. Diesel and jet fuel are particularly important because they power essential sectors such as both road and aviation transport.
2. Europe’s exposure to Bab el-Mandeb is three to four times greater for jet fuel than for crude oil.
The EU imports almost all the crude oil processed by its refineries and has replaced Russian barrels largely with supplies from the US, Norway, Kazakhstan and Iraq. By contrast, EU jet fuel imports have long depended disproportionately on Gulf refiners, and the Gulf has become an increasingly important source of diesel since the loss of Russian supply. We estimate that before the Houthi campaign of late 2023, trade routes potentially reliant on Bab el-Mandeb carried up to 66% of EU jet fuel imports and 58% of diesel imports, against 17% of crude. Even after rerouting around the Cape of Good Hope, these shares were still around 28% (jet fuel), 20% (diesel) and 8% (crude) in 2025. Bab el-Mandeb is therefore primarily a middle-distillate supply risk rather than a crude-oil risk. This is even more relevant as Houthi forces have now gained control of the coast and the strait’s narrowest point, while increasing military pressure on Saudi energy infrastructure.
3. EU diesel imports from the US doubled while US stocks fell at twice the EU's pace, and home refining cannot quickly replace those imports.
Between February and June 2026, EU diesel imports from the United States doubled year on year. Over the same period, US commercial distillate stocks fell about twice as fast as implied EU commercial diesel stocks (−10.1% against −4.9%). This asymmetry leaves EU supply exposed to price pressure within the United States, as the recent debate in Washington over restricting diesel exports illustrates. Alongside the maritime chokepoints of Hormuz and Bab el-Mandeb, EU diesel supply thus faces a chokepoint of a different kind: US export policy. Replacing these barrels domestically is neither immediate nor straightforward. EU refining capacity is shrinking, and the crude slate has moved away from the medium-sour grades many European refineries were built to process. Given the disruption in the Gulf, middle crudes are becoming more contested between European and Asian buyers (hence costly). Supply-security strategies must account for refinery capabilities and crude quality, while combining targeted stock releases with credible demand-reduction measures.
Figures in italic are GTPO estimates, based on open data sources.
Introduction
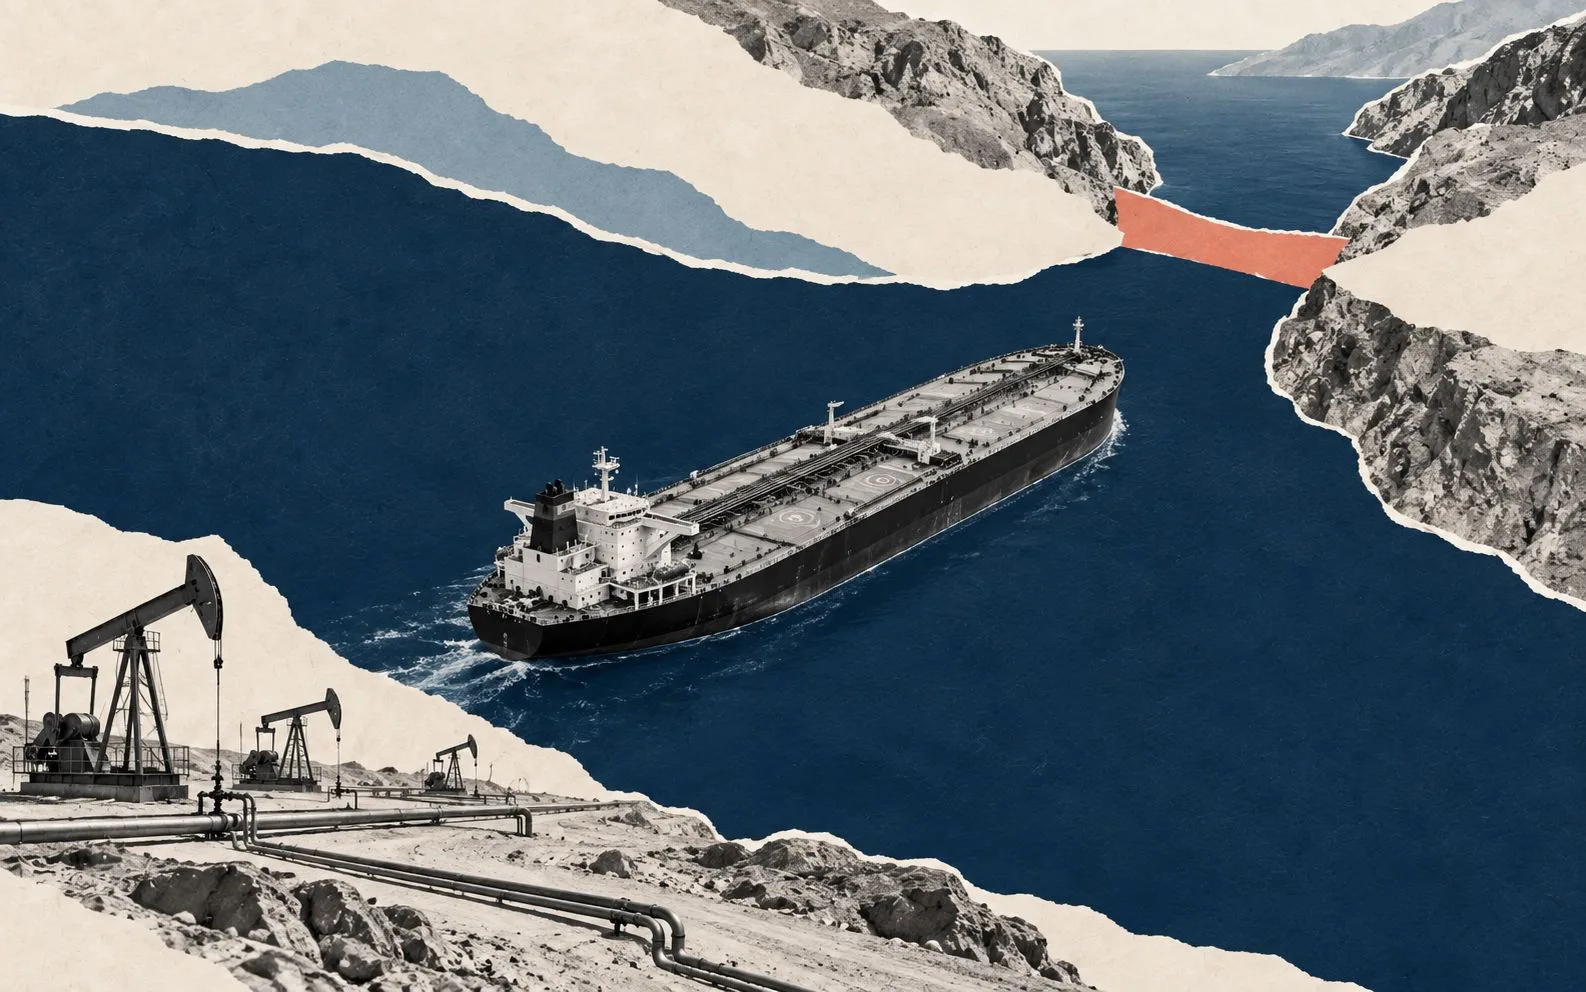
Global energy markets have been experiencing significant volatility and pressure since the launch of US and Israel war to Iran on 28 February 2026. The conflict has renewed the strategic relevance of maritime chokepoints. The closure of the Strait of Hormuz, the essential transit route for 20 million barrels per day (mb/d) before the crisis, results in oil flows disruption. Energy security has entered into a new phase with energy infrastructure and flows being severely impacted. The crisis level has recently further increased following the Houthi forces seized port of Mokha and pushed onto Perim Island, at the narrowest point of Bab el-Mandeb, extending disruptions to one of the few alternative routes to Hormuz: Bab el Mandeb1.
However, disruptions and energy security concerns extend well beyond crude production and trade. Growing concerns are emerging around refined products, the real products that power many sectors from transport, heating to petrochemicals. Refinery throughputs reached new records in summer, yet lower than last year’s levels. Prices are soaring with diesel/gasoil surpassing the $200/b mark in the US (94% above pre-war levels2). Similar prices were recorded in both Europe and Asia despite refineries having increased their production and postponed maintenance plans to seize the economic opportunities. Atlantic Basin refining margins hit record highs. However, the loss of diesel exports from the Gulf region (and Russia) stood at 1.6 mb/d below February levels3.
Over the past year, attacks on refining capacity and trade disruptions have increasingly inflamed oil products prices and crack spreads4. The current diesel squeeze is prompting governments to consider solutions to reduce import exposure and prices, ranging from further coordinated emergency measures to more unilateral measures like diesel export bans or higher domestic refining production. The pressure is expected to remain. The US administration is explicitly considering a diesel export ban to shield American citizens. On 22 September 2026, President Trump expressed support for a ban on US diesel exports, followed by Treasury Secretary Scott Bessent’s statement about considerations on the feasibility of a full or partial ban given refining capacity5. Such a move would have profound negative consequences in both US and international markets as several analysts and institutions explained6. As a result, Energy Secretary Chris Wright stated that “the blunt tool of banning diesel exports definitely doesn’t work”7. However, no decision had been taken at the time of writing.
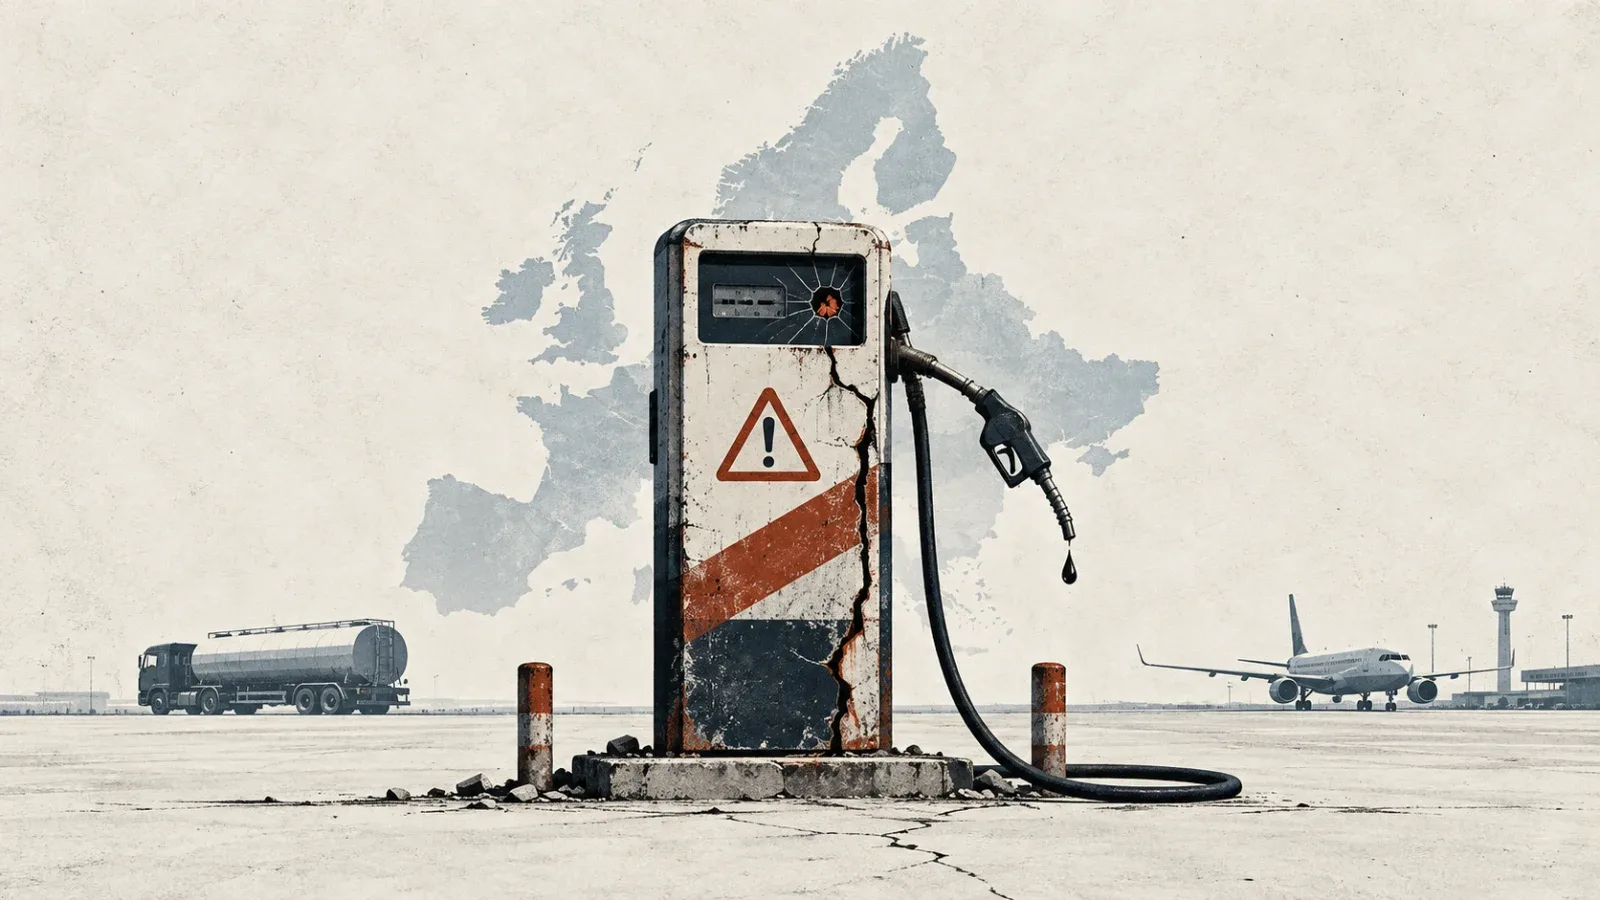
The EU lies between the maritime chokepoint in the Middle East and the policy chokepoint on the other side of the Atlantic. Furthermore, limited adequate crudes available in the market increases competition with Asian buyers, while domestic constraints to its refining capacity give limited space to manoeuvre.
This note outlines Europe’s position in the global oil products markets, by presenting its consumption, production, imports and exports. Particularly, the note explains the EU exposure to the Bab el Mandeb route and specific criticalities across refined products. Drawing on this, the note also evaluates current and future policy solutions to reduce the crisis’ negative consequences.
The EU produces some of the refined products, yet is a net importer of key refined products. The EU is exposed differently to crude oil and refined products imports. The EU is a heavy net crude importer, with domestic production covering barely 3% of what its refineries consume8. Refined products, by contrast, show a different dynamic. Both gross imports and exports have grown since 2013, but exports have exceeded imports since 2020: the EU-27 has been a small net exporter of refined products, in aggregate, for the last six years, reversing the persistent net-import position of 2013-2019 (Fig. 1).
The aggregate net-exporter position, however, hides the EU exposure to specific products affected by disruptions in the Middle East. Breaking the latest data available (through June 2026) down by product shows the EU is a comfortable net exporter of gasoline, fuel oil, naphtha and the residual “Other”9 category. By contrast, it is a net importer of diesel/gasoil, jet fuel, and LPG (Fig. 2).
1. Europe’s refined products consumption and production
Refined products are necessary for transport. Diesel’s final consumption shares are accounted for 74% by road transport and a further 8% households (heating oil); jet fuel is 98% aviation (86% international flights, 12% domestic); fuel oil is 91% international shipping bunkers; gasoline is 97% road transport; naphtha is 97% a petrochemical feedstock (Fig. 3).
None of these can be swapped for another product on short notice — an airline cannot burn diesel, and a truck fleet cannot run on jet fuel — which is exactly why a supply shock concentrated in diesel and jet (as both Hormuz and Bab el-Mandeb disruptions specifically are, see Section 6) can bite.
The EU refining base has been declining over time. As mentioned, the EU is also a producer and exporter of refined products. However, this position has reduced over the past decade. Indeed, EU-27 refining capacity has fallen by roughly 13% since 2000, from 13.8 mb/d, to 12.8 in 2013 mb/d, and to 12.0 mb/d in 2025. From a national perspective, the refining capacity is heavily located in few member states: Germany, Italy, Spain, the Netherlands and France remain the five largest EU refining nations by a wide margin, and together with the next five (Belgium, Poland, Greece, Sweden, Portugal) they account for essentially all of it. Seven of the EU's 27 members have no meaningful refining capacity at all (Fig. 4).
Seen from the world map rather than the EU alone, Europe's 14.4 mb/d is the smallest of the three traditional refining centres (Middle East 11.9 mb/d is smaller still, but growing) and dwarfed by Asia Pacific's 38.0 mb/d, more than a third of world capacity on its own (Fig. 5).
Europe's declining trend has been accompanied by the opposite trend around the globe with direct consequences for the diesel and jet fuel trade. Particularly, Gulf refiners added roughly 1.6 mb/d of capacity between 2020 and 2024 alone10, exactly the new supply that turned the region into one of the EU's largest sources of diesel and jet fuel over the past decade (Section 6). The current conflict has severely impacted not only trade but also the region's refining capacity. Indeed, Iranian strikes have now damaged exactly that refining capacity, such as UAE's Ruwais, Bahrain's Sitra and Kuwait's Mina Abdulla refineries among others.11
Consumption for refined products has been steady in the last 10 years, with an increase in gasoline and jet fuel. The analysis of the different trends of EU production, consumption, imports and exports over the 2013-2025 period shows that crude oil imports are down only 6% and consumption essentially flat (−0.3%). Fuel oil has declined sharply across the board (imports −60%, exports −39%, production −23%, consumption −24%). By contrast, jet fuel stands out in the other direction: both imports and exports up 56%, production up 12% and consumption up 23%. Naphtha exports rose 226% (Fig. 6).
For jet fuel, EU consumption has steadily outpaced production over time. Looking at the EU's domestic refinery production and consumption by product (Fig. 7) shows where imports are essential to meet EU consumption. For example, gasoline and fuel oil production sit comfortably above consumption, diesel is close to balanced with production trailing slightly, while jet fuel and LPG show consumption running well ahead of what the EU refines itself.
The dependence on jet fuel imports is not new and has not been closing. Every single year since 2009, consumption has exceeded domestic production. However, the trend has also continued since 2021 with consumption consistently outrunning production, resulting in an absolute gap in 2024 comparable to the peak before the pandemic (Fig. 8).
2. Europe’s shifting import dependencies
The shift in the EU’s import dependencies for crude and refined products has been substantial. Historical import trends show a general reorientation across all products over 2013-2025. Russia’s war against Ukraine and the consequent energy decoupling between the EU and Russia, resulted in the major transformation in crude oil imports and dependence.
The shift in crude imports has been from Russia towards the US. Back in 2013, Russia supplied 35% of EU crude imports, more than the next four suppliers combined. By 2025, Russia disappeared from the top ranks, replaced by a more diversified mix led by Norway (14.5%), the United States (13.7%) and Kazakhstan (13.3%). The Gulf's own share of EU crude rose only modestly over the period, from 8.9% (Saudi Arabia alone) to 12.9% (Saudi Arabia and Iraq combined). In this sense, the EU exposure towards Hormuz is limited as the post-2022 replacement barrels came mainly from the US, Norway and Kazakhstan, not the Gulf (Fig. 9).
The reorientation from Russia is also visible for refined products, although more towards Gulf countries. Similar reorientation is also visible for all refined products combined with the US accounting for 15% in 2025 replacing Russia’s share (33% in 2013). Nonetheless, the Gulf’s share has risen fast underneath. For example, Saudi Arabia and Kuwait together played a minor role in 2013, but they have become the third- and fourth-largest suppliers by 2025, at a combined 18% (Fig. 10).
Imports of jet fuel come disproportionately from the Gulf. Concerning jet fuel, the Gulf was already the dominant supplier bloc in 2013 (UAE, Saudi Arabia, Kuwait and Bahrain together around 49% of imports) and remains so in 2025 (Kuwait, UAE and Saudi Arabia together around 46%). Although Europe's structural reliance on Gulf-refined jet fuel did not change, the bloc increased its dependence specifically toward Kuwait (Fig. 12).
Imports of diesel/gasoil come predominantly from the US and the Gulf. Product-wise, the most relevant rise in Gulf share is in diesel. In 2013, Russia was the top diesel supplier at 31%, but it has been replaced at the top by Saudi Arabia alone, at 26% in 2025. From a Gulf perspective, the Gulf's combined share of EU diesel imports rose roughly thirteen-fold, from about 2.4% to 31.6% (Fig. 11).
Imports of jet fuel come disproportionately from the Gulf. Concerning jet fuel, the Gulf was already the dominant supplier bloc in 2013 (UAE, Saudi Arabia, Kuwait and Bahrain together around 49% of imports) and remains so in 2025 (Kuwait, UAE and Saudi Arabia together around 46%). Although Europe's structural reliance on Gulf-refined jet fuel did not change, the bloc increased its dependence specifically toward Kuwait (Fig. 12).
In conclusion, Europe successfully diversified its crude sourcing away from Russia toward the Atlantic Basin, but for the two products it is actually short on — diesel and jet — replacement supply came disproportionately from the Gulf, which explains the EU exposure towards both the Hormuz blockade and the Bab el-Mandeb disruption for refined products, with serious energy security implications for the bloc.
Bab el-Mandeb poses risk for refined products more than crude. We estimate EU-bound crude and product flows through Bab el-Mandeb at around 862 kb/d over the first half of 2026 (partial-year, annualised), down from a peak of 2.2 million b/d in 2023. Most of that decline happened before the current war following the beginning of the Houthi campaign against merchant shipping began in late 2023. This led to rerouting some of the trade around the Cape of Good Hope (Fig. 13).
What is relevant is the product breakdown rather than aggregate figures. Indeed, we estimate that, before the late-2023 disruption, trade routes potentially reliant on Bab el-Mandeb accounted for approximately 66% of EU jet-fuel imports and 58% of diesel imports, against 35% for total refined products and just 17% for crude oil. Similar figures have been estimated for Europe’s exposure to the Strait of Hormuz, with around 5% for crude imports, and 10% for refined products, with 90% of the latter accounted for by middle-distillates such as jet fuel OIES (2026)12. This confirms the different level of dependence and risks coming from this chokepoint, that is disproportionately a middle-distillates risk, not a purely crude risk. As a result, since 2024 those shares fell drastically, yet still led by jet and diesel by a wide margin showing limited space to reduce the dependence entirely (Fig. 14).
3. Crude quality: what the barrels can actually make
Given regional tensions and import exposure to chokepoints, the EU needs to reconsider how to enhance energy security. One solution could be to increase crude imports and refine it at home. However, such an option runs into a fundamental factor, often overlooked: crude quality13. Shifting from one crude to another is challenging because of the refining complex's specific characteristics14.
A crude's API gravity governs the natural boiling-point distribution a refinery obtains from straight-run distillation. Within the light-to-medium range, medium gravity crudes, like Russia’s Urals, yield a larger share of middle distillates (diesel- and jet-range material) directly off the atmospheric column than light grades such as WTI. This is one reason many European refineries were built and calibrated around exactly that kind of barrel. A lighter slate yields relatively more naphtha and light ends and relatively less straight-run diesel and jet per barrel.
The previous major energy crisis in 2022 and the diversification away from Russian oil changed the physical character of the crude European refineries now run. The API/sulfur mix of EU crude imports has shifted sharply lighter and sweeter. Medium Sour crude (the class Russian Urals belonged to) fell from 31% of imports in 2013 to just 6% in 2025, while Light Sweet crude rose from 39% to 51% and Medium Sweet crude rose from 9% to 22%. Light Sour crude, by contrast, fell as well, from 13% to 8% (Fig. 15). In 2022, Iraqi crude oil contributed to partially replace Europe’s Urals imports15 – especially in the Mediterranean refineries while the broader replacement came from the US, Norway and Latin America. The EU has thus partially replaced its exposure to a sanctioned-driven chokepoint to a maritime chokepoint. Furthermore, the current crisis in the broader Middle East has disrupted European refineries' existing alternatives and the transit routes for other producers outside the region, including importing products from Asian countries. Moreover, the increased reliance on US oil and products supplies has been put under the spotlight given the growing inward looking approach taken by the current administration as the potential diesel export ban illustrates. Lastly, global consumers are increasingly competing for similar crudes, especially medium crude, pushing prices at record levels. The joint disruption of crude and products coming from the Gulf poses an economic and security issue for Europe. In this challenging context, refined products markets have experienced remarkable price volatility. This is also inducing governments to consider taking or enhancing extreme decisions such as diesel export bans. Such a move, explored by the US Administration due to social pressure, will ultimately backfire and wrack the global markets.
4. A mixed crisis management: stocks, subsidies and global implications
To offset the crisis's negative consequences, EU countries have been using their emergency stocks. On 11 March 2026, IEA member countries agreed to the largest coordinated release of emergency oil stocks in the agency's history, 400 million barrels16. Of which the EU contributed around 118 million, weighted toward refined products — precisely because national strategic reserves alone were judged insufficient to cover a disruption of this scale and duration17.
Total reserves for refined products are within seasonal patterns, although risks are tilted to the downside. Although emergency stocks prevented a more substantial rise in prices, they represent a temporary buffer - especially if the release is not coupled with demand-side measures. EU-27 emergency stock cover fell across all three products from January to June 2026, most sharply for jet fuel (−35%), followed by gasoline (−29%) and diesel (−20%). While in line with broader seasonal patterns, the level of jet fuel reserves is the more concerning of the three: it ran materially below its normal seasonal band for an extended February–March stretch (roughly −9% to −15% below normal, in both the emergency reserve and total national stock), before recovering to roughly normal by June (Fig. 16).
Recent events compound these risks. While data after June is not available yet, further pressure on refined products are likely to increase, given the September escalation at Bab el-Mandeb. Saudi Aramco told at least two European refining customers they would receive no crude oil under their contracts in October 2026, following the September pipeline attack18, while the US administration is considering banning diesel exports amid domestic price pressure19. The US in fact seems to have drawn down its own strategic and commercial reserves at roughly twice the rate of the EU’s (US commercial distillate fell 10.1% vs. EU implied commercial diesel at 4.9%. At the same time, the US SPR fell 20.6% between February and June 2026 (31.4% as of mid-September), with the EU's emergency stock of crude rising slightly. Lastly, EU diesel imports from the US nearly doubled (99.6%) compared to the same (February - June) months in 202520. This asymmetric response may be an additional source of political tensions in the transatlantic relationship.
With Gulf refined-product exports, the marginal supply most exposed to chokepoint disruption, and the risk of frictions with the US, Europe's stock buffer has little room to absorb a further shock without either being drawn down toward regulatory minimums or forcing the kind of demand-rationing measures some member states have already begun to discuss. Given the dire situation, President Macron has called for a new release and a more coordinated approach.2122
Shortsighted emergency measures. Meanwhile, most EU countries have largely replicated the same approach to price spikes23 used in the 2022 energy crisis: untargeted subsidies. According to Bruegel, European governments have committed more than €11.8 billion to shield consumers from energy price spikes. Many governments have indeed cut taxes and levies on energy products to artificially reduce prices; however, the majority of these fiscal supports increase the incentives to consume fossil fuels risking to further exacerbate the crisis. Additionally, the EU has entered into this crisis in more difficult fiscal conditions. By contrast, Asian countries, generally more exposed to Middle Eastern imports, have pushed more for demand-side responses.
Key takeaways
The crisis in the broader Middle East highlights the need to incorporate the entire value chains into the energy security analysis. Since February 2026, the limited exposure to Middle Eastern oil (and liquefied natural gas) imports may have induced Europeans to consider themselves partially shielded - especially compared to 2022 when Europe was the epicentre of the crisis. However, the exposure is more significant in the case of key refined products. Indeed, refined products imports from the Middle East and beyond have gained particular relevance for the EU over the past decade. This was driven by the energy decouple between Europe and Russia after 2022, which also drove the increase of imports from US, Norway and Latin America. In 2026, both of these challenges come with risks. The US has been pursuing a more inward-looking strategy even considering a diesel export ban. And Gulf producers have been affected by trade disruptions and attacks on their energy facilities, impacting both crude and refined products. Therefore it’s critical to preserve the energy infrastructure, especially those that allow the spare capacity in the region to reach the market, such as the East-West Pipeline.
Import more crude and enhance the domestic option ? Governments could consider increasing crude imports and supporting domestic refining capacity. EU refineries have already raised output, but constraints remain, including maintenance schedules and logistics. Higher utilization rates have had a limited effect, as they cannot offset the physical loss of product imports from the Gulf. Alternative crude supplies are also becoming more contested and more expensive, owing to longer distances (e.g. from Latin America), higher freight costs and competition from other importers for similar crude grades. Moreover, EU refining capacity has declined over the past decade and is expected to decline further. The EU should therefore consider managing and preserving some strategic refining capacity despite falling demand, but universal support is not an option given fiscal constraints, weak business cases and European refiners' cost disadvantage relative to other major regions.
Manage the consumption and the buffers. Given the situation, the EU has drawn from its emergency stocks although at a lower level compared to the US. However, fiscal measures aimed at reducing prices artificially have often sent the opposite signal to consumers, potentially worsening the situation. The EU stockpiles are equipped precisely for this kind of crisis as it prioritized products stocks. Yet, it needs to outline realistic plans to cope with price spikes and push for demand reduction - especially in those sectors where there are alternatives (i.e., electrification for road transport).
Technical Appendix
Note on Final Consumption
Consumption figures in the analysis do not rely on Eurostat's standard "final consumption" total on its own, because that measure excludes international aviation and shipping bunkers. Jet fuel and fuel oil are consumed overwhelmingly as international bunkers (aircraft and ships refueling for cross-border journeys) which Eurostat's accounting treats as outside final consumption entirely. Thus we keep international aviation and marine bunkers as their own explicit categories alongside domestic final consumption, rather than omitting them. This same sector-level consumption data currently runs only through 2024 so any "latest year" consumption snapshot in this report is one year behind the trade and quality data shown elsewhere.
Bab el-Mandeb exposure estimate
Approach. The estimate does not trace shipping routes. Instead, a country's entire EU-bound export (from Eurostat) of a product is classified as transiting Bab el-Mandeb if that country lies east of the strait (Saudi Arabia, Iraq, UAE, Kuwait, Qatar, Oman, Bahrain, India, Singapore, or South Korea), and as not transiting otherwise.
Cape of Good Hope correction. Since the Houthi attacks began (November 2023), much Gulf crude has rerouted around the Cape while still originating from an "East" country, which, if not addressed, would otherwise be miscounted as transiting Bab el-Mandeb. For crude, a per-country, per-year correction (EIA Suez/SUMED data, 2020–2024 plus 1H2025) is applied, but only to Iraq and Saudi Arabia (UAE reuses Iraq's figure); it rises from near zero in 2020–2023 to 72% (2024) and 80% (1H2025) of Iraqi/UAE crude, then held flat through 2026. Saudi Arabia's correction stays near zero, not because its crude is unexposed, but because its Europe-bound crude loads mostly from Yanbu, on the Red Sea coast, so it was never making the same potential re-routing Iraqi crude can make. Every other Gulf/Asian country gets no crude correction at all. For refined products, only one flat global discount exists (70% for 2024, 61% for 1H2025, held flat forward), applied uniformly regardless of country.
Known routing gaps not captured by this model:
- Saudi Arabia's refined-product exports. Saudi Arabia supplied 26% of EU diesel imports in 2025. A majority of its export-refining capacity (Yanbu, Rabigh, Jiza) sits on the Red Sea, going through pipeline rather than through tankers, so cargoes sail directly to Suez without needing Bab el-Mandeb to be transited through. This is not captured by our estimates. Diesel volumes are thus likely to be overstated as a result.
- Saudi pipeline outage (as of writing). The East-West Pipeline (Petroline), which feeds the Red Sea refineries above, was itself shut September 11, 2026 after drone attacks. For the duration, Red Sea refinery runs are likely curtailed, and any seaborne resupply would itself require Bab el-Mandeb transit. As of writing, the pipeline has re-opened.
- Iraq's Kirkuk-origin crude. Iraq is treated as one undifferentiated country, but Kirkuk-origin crude exports via the Kirkuk–Ceyhan pipeline overland through Turkey to the Mediterranean, also never passes through Bab el-Mandeb. The pipeline was shut March 2023–September 2025 and has since reopened, so this is a current gap in our estimates.
- Net effect: both gaps suggest that true Bab-el-Mandeb-transiting flow is likely lower than this estimate shows.
Crude Quality mix estimate
Approach. For each of the two snapshot years (2013 and 2025), every supplier country above 2% of EU crude supply is assigned a volume-weighted API gravity and sulfur content. 2013 uses the European Commission's own Crude Oil Import Register (field-of-origin volumes) joined to a published API/sulfur reference table; 2020 onward uses Eurostat's live crude-import-register data, which reports API gravity, sulfur, and volume per named stream directly (Eurostat has no field-level breakdown before 2020, which is why 2013 draws on different data). Each country's own multiple streams are then classified individually and, within a country, each stream's own share of total supply lands in its own class (not one blended class per country).
Classification thresholds and the Russia split come from Öhlinger, Irlacher & Güntner (2024). Density/sulfur classes (Light ≥31.1° API / Medium 22.3–31.1° / Heavy <22.3°; Sweet <1.0% sulfur / Sour ≥1.0%) follow the classification formulas in that paper's own published quality-crosswalk, applied to each named crude grade's own reported API and sulfur. For Russia in 2013, where most import volume is reported only as "Other Russian Crude" with no grade attached, 70% of that residual is treated as Urals and 30% as Siberian Light Sweet (the paper's own assumption, based on EU institutional estimates that around 80% of Russian imports are Urals).
What it does model: real, field-level EU import volumes and quality per country and year, with each country's mixed grades classified separately rather than averaged into one label.
What it does not model:
- Roughly 9–10% of supply each year has no quality data at all (countries below the 2% threshold) and is reported as "Unclassified," not estimated 2013 coverage is limited to the 22 countries the EC register reports, not all 27 EU members
- Quality is assigned per named grade, not per shipment or vessel
Emergency Oil Stocks
The stock-cover charts in this report use Eurostat's "gross inland deliveries, calculated" as the demand denominator, divided into that same month's closing stock. This is not the ideal one, but is the only consumption series Eurostat publishes at monthly frequency, which is what lets these charts show real month-to-month and seasonal movement rather than one flat annual number. The more accurate bottom-up measure — actual fuel use by sector (road transport, aviation, shipping) — exists, but only at annual frequency. The trade-off is a small, consistent bias: the first runs above that more accurate annual benchmark for all three products (modestly for diesel and jet fuel, roughly 3-4%, and more sharply for gasoline, roughly 12%). Because days of cover is stock divided by this denominator, an inflated denominator understates the true figure. In practice, this means true stock cover is likely somewhat higher than what these charts show, modestly so for diesel and jet fuel, more so for gasoline. This bias affects the level of each series but not its shape: since it applies consistently across months, the seasonal patterns, year-over-year comparisons, and range/average bands should remain valid.
Notes and references
-
CNBC, “Mokha: Houthis seize Yemen port, raising threat to oil and shipping”, 11 September 2026; NPR, “What to know after a week of Houthi attacks that threaten Saudi oil”, 18 September 2026. ↩
-
IEA, "Oil Market Report – September 2026", 11 September 2026. ↩
-
Ibid. ↩
-
Cahill, B.. "No quick fixes for the squeeze on refined products." . 9 September 2026, . Atlantic Council, EnergySource. ↩
-
Axios, “Trump backs diesel exports ban, marking a shift for administration”, 22 September 2026 ↩
-
Garrett Golding and Lutz Kilian, "A Ban on U.S. Crude Oil Exports Would Not Lower Gasoline Prices at the Pump", Federal Reserve Bank of Dallas, 4 January 2022 ↩
-
Reuters, “US Energy Secretary Wright says diesel export ban would not work”, 23 September 2026 ↩
-
EU-27 domestic crude production of 15.6 Mt against refinery consumption of 490.8 Mt in 2025. Source: Eurostat and author's calculations. ↩
-
“Other” is Eurostat's own all-refined-products total minus the six named products — mainly bitumen, lubricants, petroleum coke, refinery gas, sulfur and wax. ↩
-
Oxford Institute for Energy Studies, "Europe's Oil Vulnerability to the Strait of Hormuz Disruption", April 2026. ↩
-
IEA, “Oil Market Report”, 12 March 2026. ↩
-
Oxford Institute for Energy Studies, "Europe's Oil Vulnerability to the Strait of Hormuz Disruption", April 2026. ↩
-
Crude quality is generally categorized along two dimensions: API gravity, which measures how light or heavy the oil is (higher = lighter, yielding more gasoline/naphtha; lower = heavier, yielding more fuel oil/residue), and sulfur content, the share of sulfur by weight (crude above 0.5% is "sour" and needs more refining; below that, "sweet" and needs less). Together, these two measures determine what a barrel can economically yield and how costly it is to process. ↩
-
See Öhlinger, Peter, Michael Irlacher, and Jochen Güntner. "Not all oil types are alike in trade substitution." Nature Communications 15.1 (2024): 7476. ↩
-
Argus Media, "Viewpoint: Mediterranean refiners look to Iraq", 28 December 2022. ↩
-
IEA, "IEA Member countries to carry out largest ever oil stock release amid market disruptions from Middle East conflict", 11 March 2026. ↩
-
CNBC, “The biggest release of emergency oil stockpiles in history was announced. Why crude may keep rising”, 14 March 2026; Al Jazeera, “IEA announces release of 400 million barrels of oil. But is it enough?”, 13 March 2026. ↩
-
Bloomberg, "Saudis Tell European Refiners They'll Get No Crude Next Month", 18 September 2026. ↩
-
Financial Times, "Donald Trump says he would back US diesel export ban", 22 September 2026. ↩
-
Authors' calculations based on Eurostat and EIA. ↩
-
Bloomberg, "Macron Calls for G7 Meeting to Mull Release of Oil Reserves", 18 September 2026. ↩
-
S&P Global Commodity Insights, "European countries urge for joint policy action to tackle soaring oil prices", 22 September 2026. ↩
-
Bruegel, "2026 European energy crisis fiscal response tracker". ↩